最近接活,客户需求是给现有的CMS系统记录文章阅读量,要求按天统计做出柱状图表,三下五除二就做完了,客户很满意。
这个CMS系统是易优CMS|企业建站系统_免费_安全_易用-Eyoucms
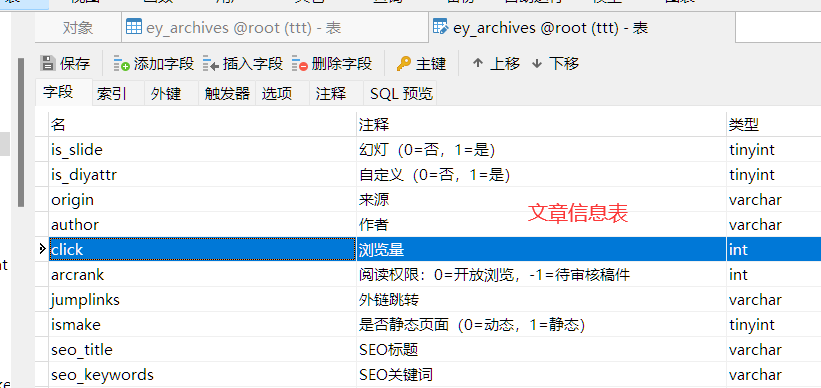
内部仅仅是做了文章访问量一个字段,并没有记录访问日期等等。
![image-20220523053703898 image]()
实现效果 (评估需求)
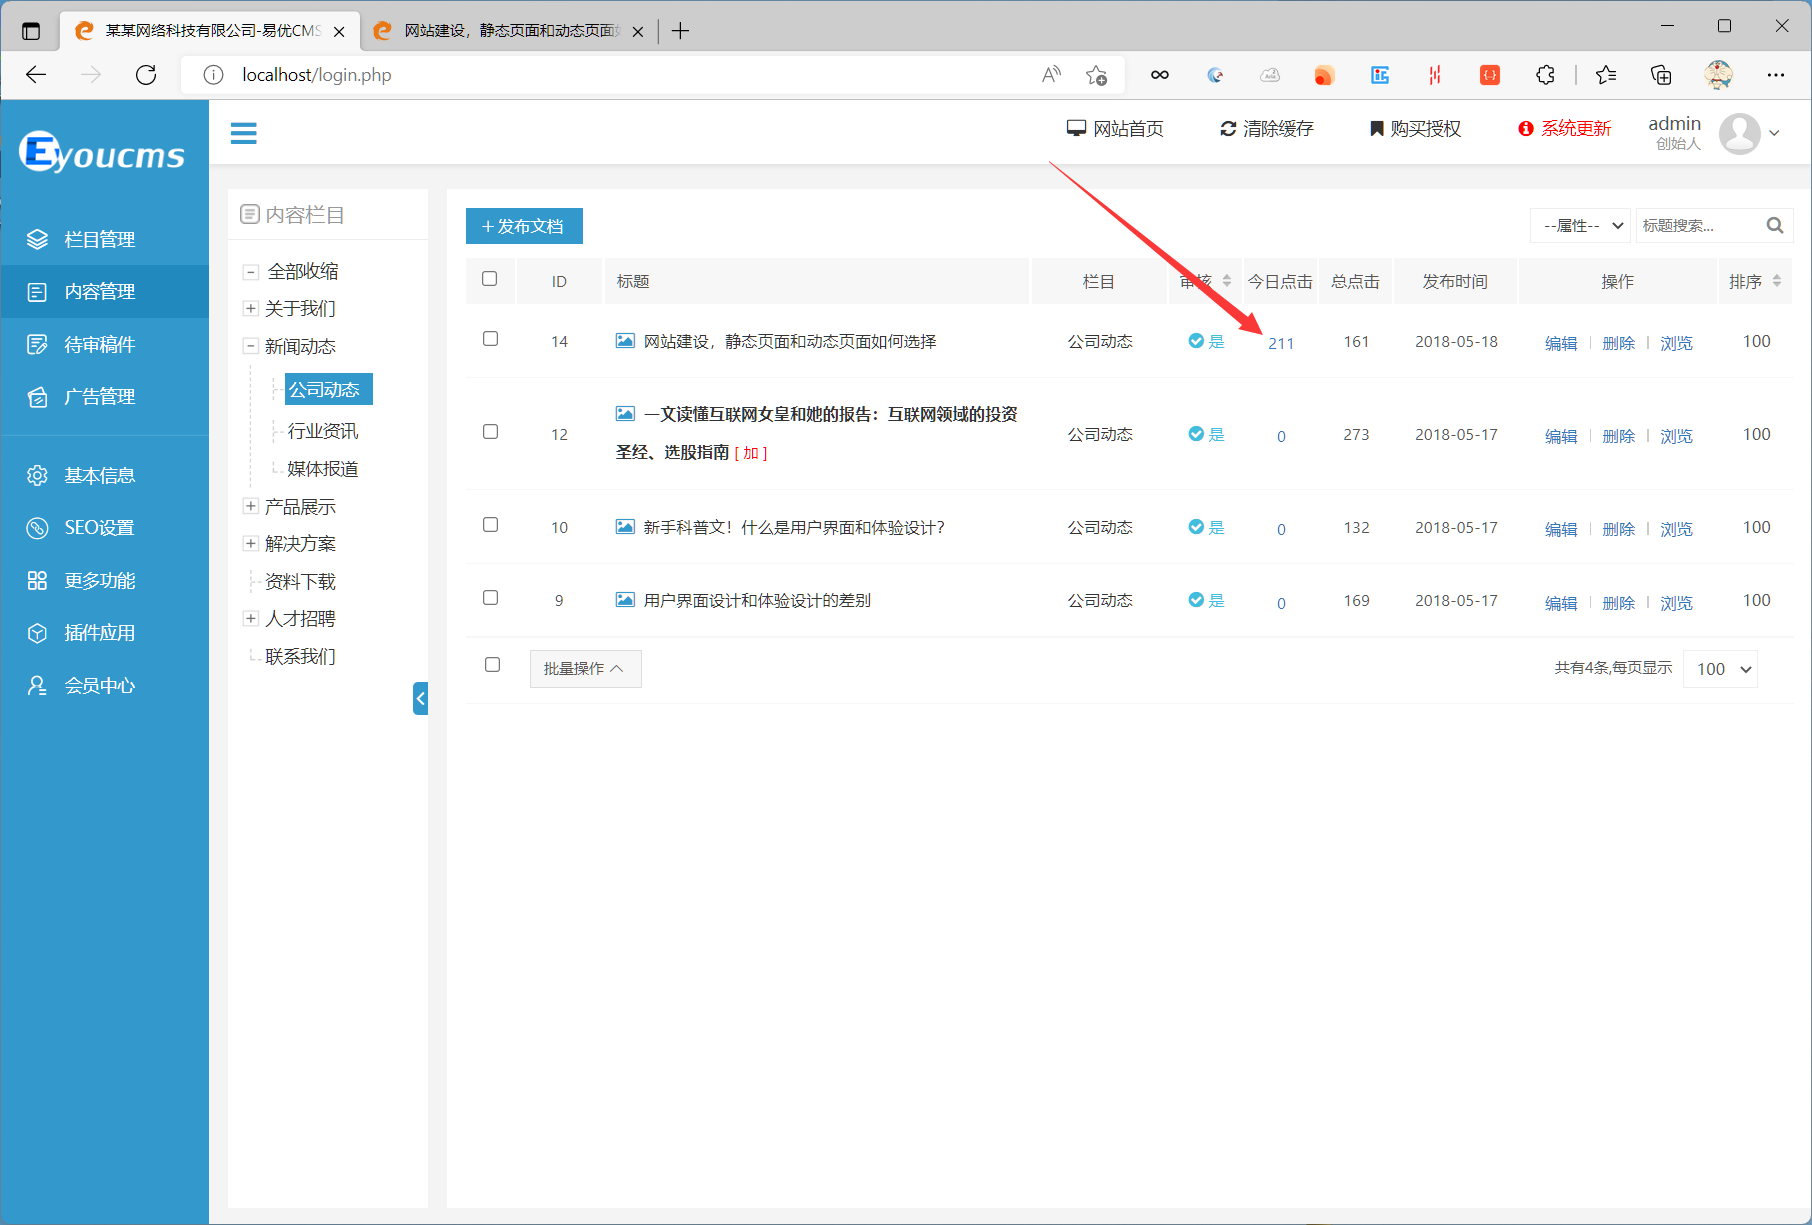
![image-20220523054017168 image]()
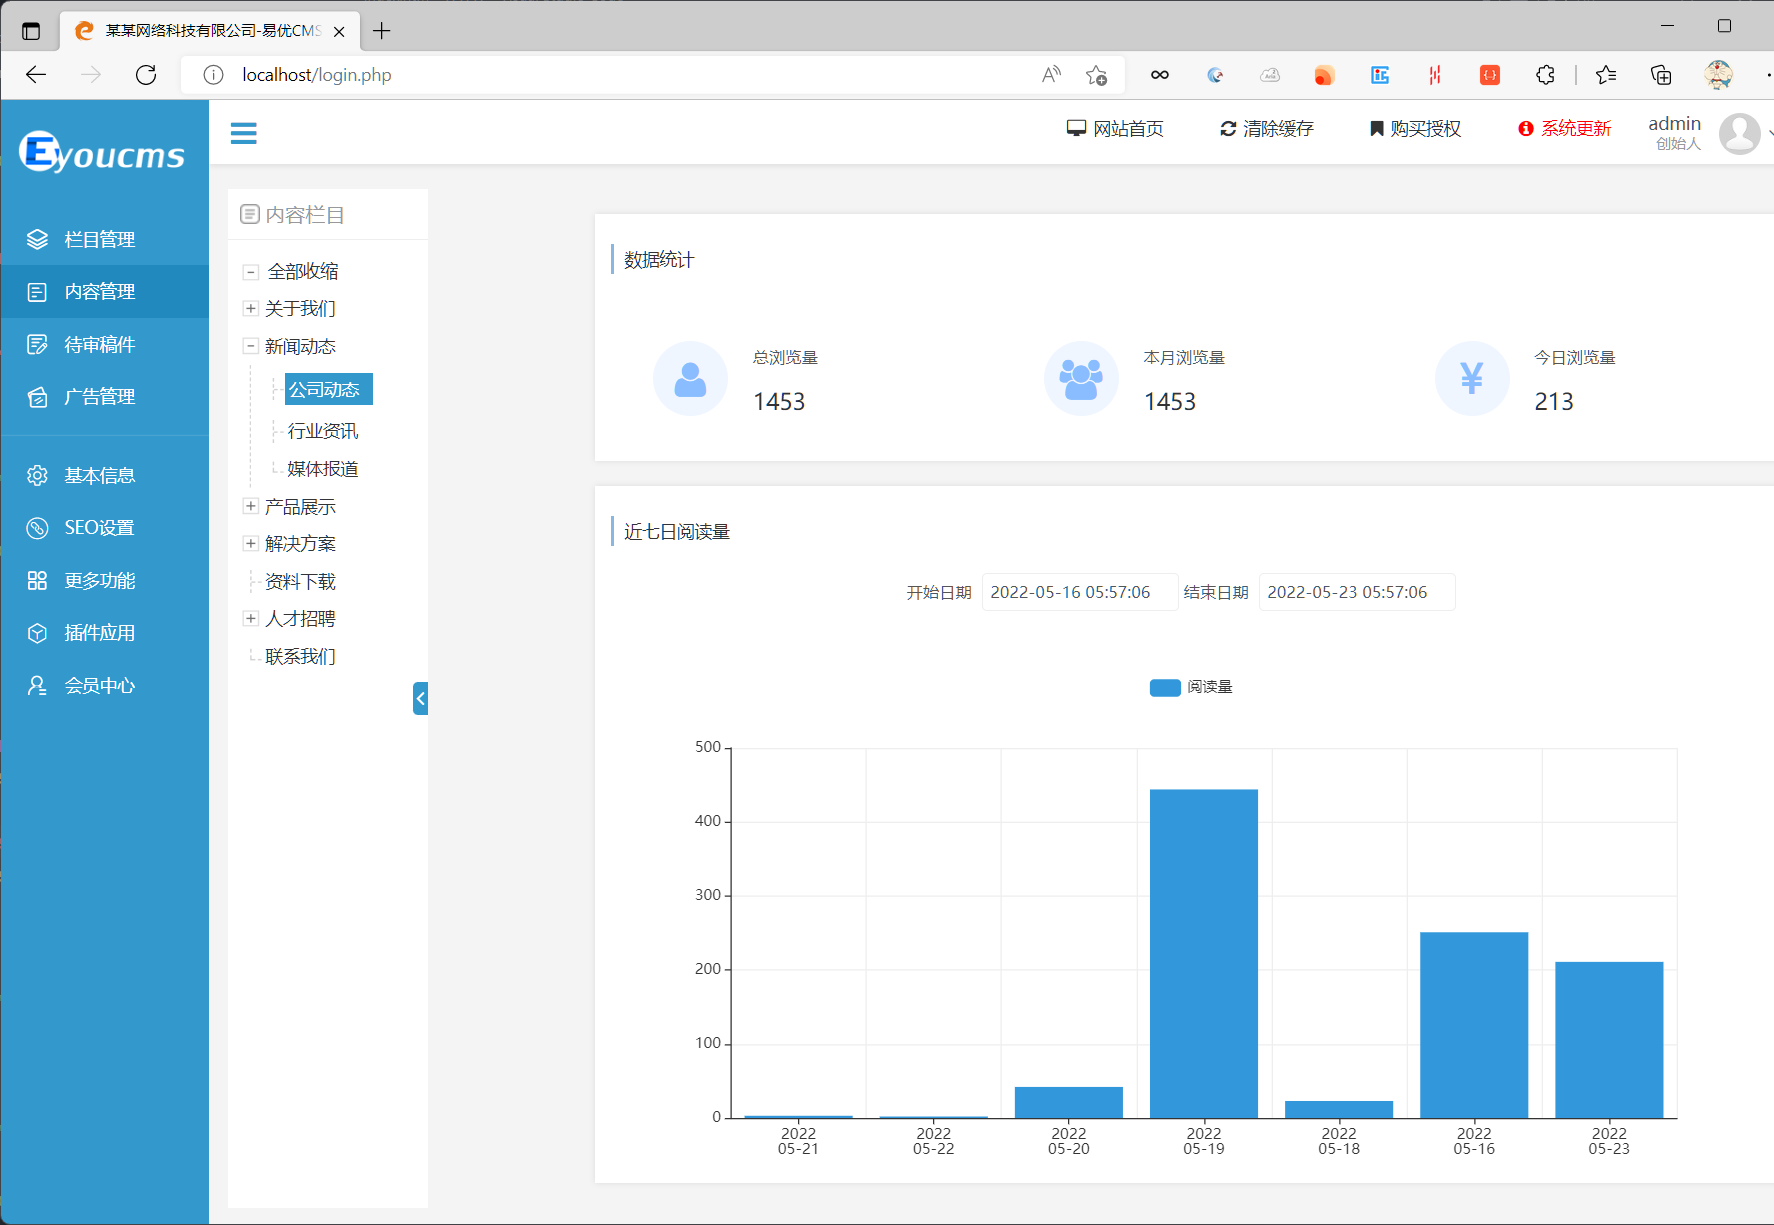
内容管理页可以看到今日浏览数量,点进数字之后可以看见汇总图表
![image-20220523055727995 image]()
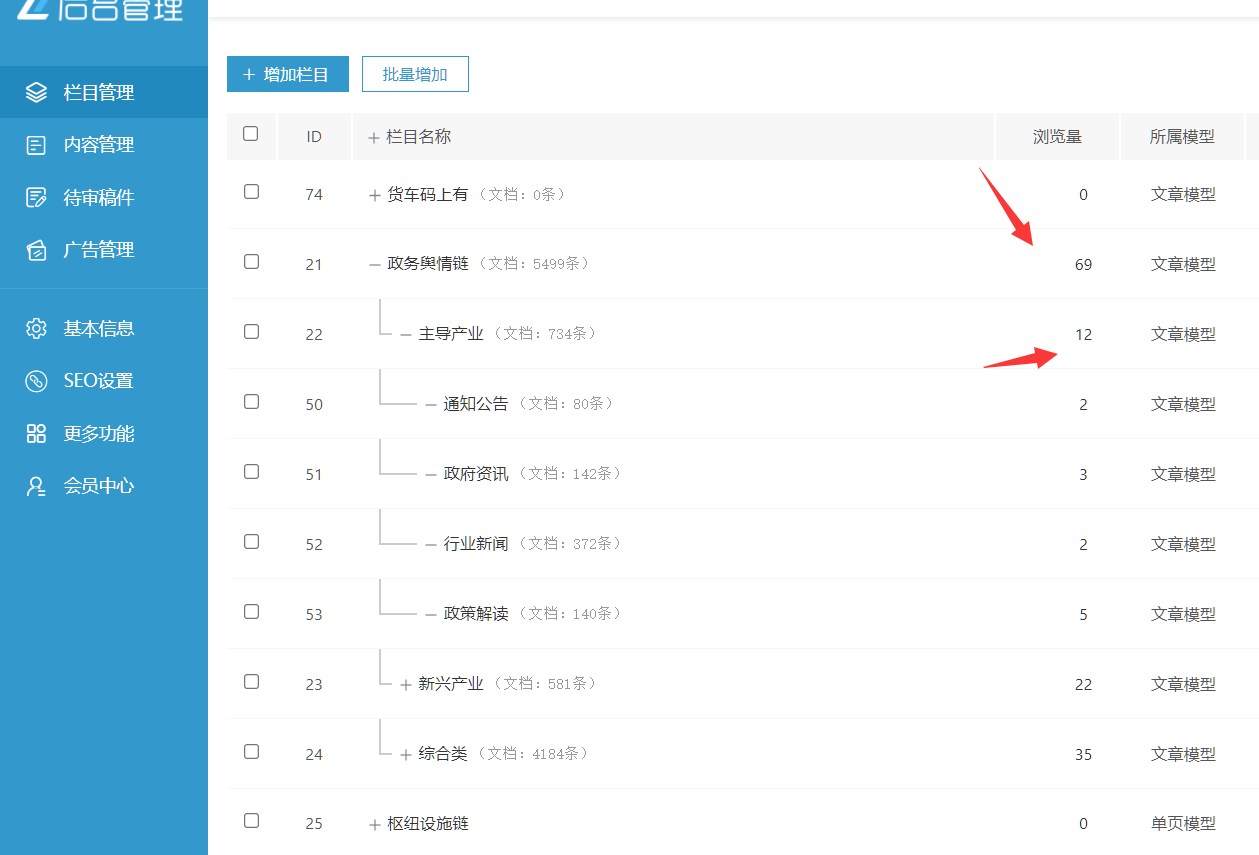
栏目管理处也可以看到栏目下的所有文章阅读量汇总
![image-20220523060322926 image]()
也是可以点进去有个图表展示,这里就不演示了。
所以总结下来,客户需求如下:
设计分析
下面分为数据库结构设计和可能用到的查询语句列表,整理出基本框架,便可以动手编程了。
结构设计
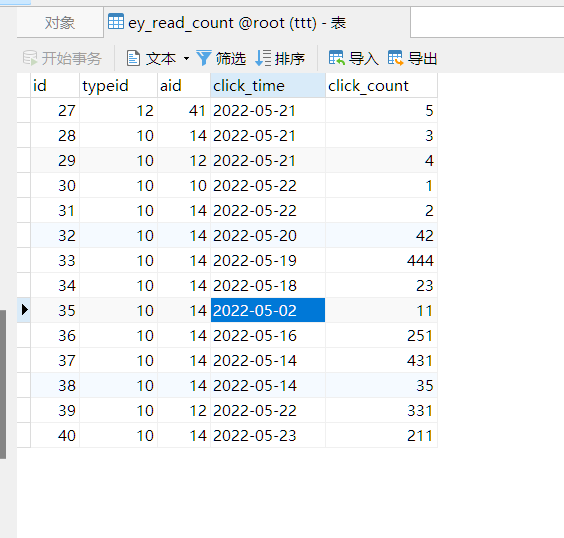
因为需要数据库记录,所以新开一张表:read_count,存储栏目编号(typeid)、文章编号(aid)、日期(click_time)、当日阅读量(click_count)日期存放精确到天
数据库操作
关于文章查询
查询今日阅读量:当前时间转成Y-m-d格式,作为条件并且带上文章ID限制去数据库查,拎出click_count字段即可
查询时间区间阅读量:传入startTime和endTime,使用whereBetween
关于栏目查询
二级栏目查询今日阅读量:同文章时间格式,带上栏目ID限制去数据库查,对时间打组(groupBy),将click_count字段汇总求和(sum)即可
查询时间区间阅读量:同文章时间格式,同以上查询条件
文章阅读记录
我这里魔改了官方统计标签arcclick,在其要对文章浏览量自增的时候,为read_count插入一条记录
前端保证传入正确的typid和aid,带上当前时间即可!
编码开发
阅读记录
首先要先有数据,先把文章阅读记录做出来
1
2
3
4
5
6
7
8
9
10
11
12
13
14
15
16
17
18
19
20
21
22
23
24
25
26
27
28
29
30
31
32
33
34
35
36
37
38
39
40
41
42
43
44
|
public function arcclick()
{
\think\Session::pause();
if (IS_AJAX) {
$click = 0;
$aid = input('aid/d', 0);
$type = input('type/s', '');
if ($aid > 0) {
$archives_db = Db::name('archives');
if ('view' == $type) {
$archives_db->where(array('aid' => $aid))->setInc('click');
$archive = Db::name('archives')->where(array('aid' => $aid))->find();
+ $read_count = Db::name("read_count")->where([
+ 'typeid' => $archive['typeid'],
+ 'aid' => $aid, 'click_time' => date('Y-m-d', time())
+ ])->find();
+ if (!$read_count) {
+ Db::name("read_count")->insertGetId([
+ 'typeid' => $archive['typeid'],
+ 'aid' => $aid, 'click_time' => date('Y-m-d', time()),
+ 'click_count' => 1,
+ ]);
+ } else {
+ Db::name("read_count")->where([
+ 'typeid' => $archive['typeid'],
+ 'aid' => $aid, 'click_time' => date('Y-m-d', time())
+ ])->setInc('click_count', 1);
+ }
}
$click = $archives_db->where(array('aid' => $aid))->getField('click');
}
echo ($click);
exit;
} else {
abort(404);
}
}
|
当访问的时候,我们的数据库就会有
![image-20220523063513457 image]()
文章统计查询
SQL什么的如我上面所说,没有什么问题,关于时间上:
1
2
3
4
5
6
7
8
9
| $today = date('Y-m-d', time());
$data_count['total'] = Db::name('read_count')->where(['typeid' => $typeid, 'aid' => $aid])->sum('click_count');
$data_count['total'] = $data_count['total'] ? $data_count['total'] : 0;
$lastMonth = date('Y-m-d', strtotime('-1 month', strtotime(date('Y-m-d'))));
$data_count['month'] = Db::name('read_count')->where(['typeid' => $typeid, 'aid' => $aid])->whereBetween('click_time', [$lastMonth, $today])->sum('click_count');
$data_count['month'] = $data_count['month'] ? $data_count['month'] : 0;
|
栏目统计文章阅读量查询
1
2
3
4
5
|
$lastMonth = date('Y-m-d', strtotime('-1 month', strtotime(date('Y-m-d'))));
$data_count['month'] = Db::name('read_count')->whereIn('typeid', $typeid)->whereBetween('click_time', [$lastMonth, $today])->sum('click_count');
$data_count['month'] = $data_count['month'] ? $data_count['month'] : 0;
|
也很简单,不过这里要注意,我用的是whereIn,后面传入个id数组,而这里的id数组也就是所有栏目id,因为要考虑顶级栏目,看代码吧
1
2
3
4
5
6
7
8
9
10
11
12
13
14
15
16
17
18
19
|
$typeid = input('typeid/d', 0);
$level = input('grade/d', 2);
if ($level == 0 || $level == 1) {
$ids = Db::name('arctype')->where('parent_id', $typeid)->column('id');
$typeid = !empty($ids) ? $ids : [];
if($level == 0){
$ids = Db::name('arctype')->where('parent_id', $typeid)->column('id');
$typeid = !empty($ids) ? $ids : [];
}
} else {
$typeid = [$typeid];
}
|
栏目表字段结构:
1
2
3
4
5
6
7
8
9
10
11
12
13
14
|
DROP TABLE IF EXISTS `ey_arctype`;
CREATE TABLE `ey_arctype` (
`id` int(10) NOT NULL AUTO_INCREMENT COMMENT '栏目ID',
`parent_id` int(10) DEFAULT '0' COMMENT '栏目上级ID',
`typename` varchar(200) DEFAULT '' COMMENT '栏目名称',
`grade` tinyint(1) DEFAULT '0' COMMENT '栏目等级',
PRIMARY KEY (`id`),
UNIQUE KEY `dirname` (`dirname`,`lang`) USING BTREE,
KEY `parent_id` (`channeltype`,`parent_id`) USING BTREE
) ENGINE=MyISAM AUTO_INCREMENT=68 DEFAULT CHARSET=utf8 COMMENT='文档栏目表';
|
三级栏目parent_id是二级栏目,二级栏目parent_id是一级栏目,一级栏目parent_id是0
这里默认是三级栏目,如果是二级栏目,查出所有二级栏目id,汇总
如果是一级栏目,先把所有二级栏目阅读数算出来,然后再把一级栏目下的所有二级栏目阅读数汇总
Echarts 图表
直接看示例,复制一份过来
Examples - Apache ECharts
也很简单,查出所有记录汇总成Echarts需要的格式就好了。
说一下我遇到的问题
x轴柱子溢出:![如何巧妙地解决echarts柱状图x轴溢出问题 image]()
参考:如何巧妙地解决echarts柱状图x轴溢出问题 - 掘金 (juejin.cn)
x轴文字太长以至于消失
![img image]()
参考:(87条消息) echarts x轴文字显示不全(xAxis文字倾斜比较全面的3种做法值得推荐)_dotnet全栈开发的博客-CSDN博客_echarts x轴文字显示不全
博主给的几种方案都不错,我最后是将年份和月日分割成两行这样,问题解决。
系统上线
客户发给我他们的宝塔面板,我直接将改过的代码贴进去了,其实一切都很顺利。
进入我写的页面报错,貌似是说“? 语法错误”,原来是我写的新语法
在他的php5上是不认的,改成php7就好了。
第一次找不到表是因为没创建,创建就好了。
总结
其实我遇到的问题不止上面这些,这个CMS系统把thinkphp内核都改了,一些数据库查询方法还带有保护字段,害我不得不去看thinkorm源码,不过也没什么,读本地的配置文件而已,源码就在手里,没有什么搞不了的。
用php做debug好麻烦啊,我纯靠脑子运行代码,一些逻辑都是我猜出来的,还有一些关于数组操作的,一见到数组我就想念lodash.js了。。。
![如何巧妙地解决echarts柱状图x轴溢出问题 image]()

